Technology
Understanding a Candlestick Chart

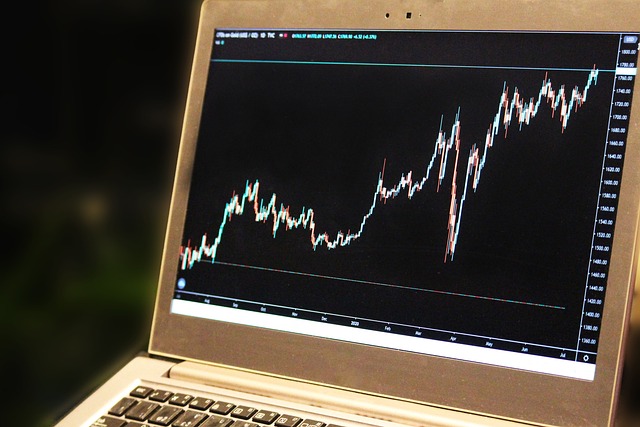
Your online trading session can hardly become successful if you don’t use digital instruments to analyze the assets. Although the majority of digital tools are considered innovative features, many indicators have their roots in the means of the 18th century. For example, when opening a chart on your platform, you’ll probably see candlesticks that were invented in Japan long before trading went online.
In this guide, we will try to outline the major points about understanding a candlestick chart and its importance in conducting a productive technical analysis of the financial market. We hope that by the end of this article you will understand how this instrument works and how to read it properly.
Getting started with candlesticks
If you know how to read a candlestick chart, you will be able to take a lot of profitable decisions when trading online. Candlestick charts are quite simple and informative at the same time. Even if you take a single look at the chart, you will be able to understand the basic tendencies since all pieces of information are provided in quite a simple form:
- Green/white – closing > opening.
- Red/black – closing < opening.
When you see the color and the wicks of the candle, you can determine whether the trend is bullish or bearish and take your next step more quickly. At this point, it’s also necessary to realize that not all bullish and bearish patterns can be identified by one candlestick. Often, candlesticks just reflect the actions of the majority of traders, which might not correspond to the objective market conditions.
Key advantages of candlestick charting
Foremost, candlestick charting is simple to read even for beginners. Everything is indicated in simple forms and distinctive colors. Nevertheless, simplicity doesn’t make this type of charting less efficient for experienced traders.
Then, candlestick charting is available across all possible time frames. Thanks to this feature, there are no limitations regarding the selection of tools you might use for your technical analyses.
One more feature to consider is that candlesticks aren’t different for forex, stock, crypto, and all other markets. They are the same everywhere, no matter what instruments you prefer. The concept doesn’t differ, although you might see candles in white and black instead of common green and red respectively.
Last but not least, candlesticks are the most frequently used patterns applied by different trading platforms and brokerage services. Thanks to this, the selection of reliable platforms, where these tools are available, is quite wide.
The importance of designs
Candlestick patterns can include a lot of important data that can help make more profitable deals. But you need to read them correctly. To be able to do this, you should be aware of the candlestick design and know what every part of such a candle means and indicates.
Basically, it ain’t as complicated because you get all the information for the body and wicks. The body might be of different lengths. This shows the level of the current trend. If the candle’s body is white, it means that this is the middle between the opening and closing prices of the bar. If these prices are identical, the body will be a flat line.
The size of the candlestick patterns is also what indicates the strength of the shown signal. The bigger the size is, the stronger the signal is.
The wicks of candles indicate the differences between the lowest and highest prices. If there’s no difference, you’ll see only the body without any wicks.
Types of patterns
Some types of candlesticks might be far more complex to read than we’ve just described. Such patterns are mainly used by experienced traders because they contain a lot of extra information.
Beginners prefer simple candlesticks such as “morning star”, “hammer’, and “Doji candles”. At the same time, these simple categories can be subdivided into more specific groups. This is relevant to hammer candlesticks that might identify bearish and bullish trends in different ways. Read more about hammer candlestick patterns if you want to find out which ones are the most convenient for you.
Best patterns
Knowing what candlestick patterns are, realizing their key functions, and understanding the differences between them are all good. But when you switch from theory to practice, you get curious about the most efficient tools. So what are the best tools?
And again, it depends. If your priority is to identify the end of a certain trend and the beginning of the opposite one, you are likely to benefit from using bullish and bearish engulfing candlesticks. These are patterns that indicate market reversals.
Conclusion
Obviously, no theory will be enough for you to fully realize how to benefit from using candlesticks. You should try applying this knowledge in real conditions. We recommend starting from a demo account. But we hope now you understand what candlestick charting is and why it is so important among other traders.

-

 Technology2 years ago
VoIP Number: Everything You Need To Know
-

 Music2 months ago
[Music] Gnash Ft Olivia O’Brien – I Hate you, I Love you
-

 Music1 month ago
[INSTRUMENTAL] John Legend – All Of Me
-

 Music2 months ago
Alan Walker – Faded [INSTRUMENTAL]
-

 Music1 month ago
[Video] 21 Savage ft. Offset & Metro Boomin – Rap Saved Me
-

 Music2 months ago
[Instrumental] Wiz Khalifa – See You Again ft. Charlie Puth
-

 ANE Stories4 months ago
[STORY] AMAKA THE LESBIAN (Complete Episodes)
-

 Music2 months ago
[Music] Akon – Sorry Blame It On Me


